

The Main Challenge
-
The main challenge was to compare the Life and Proposal portfolios while maintaining a consistent visual style and ensuring clarity for the user.
-
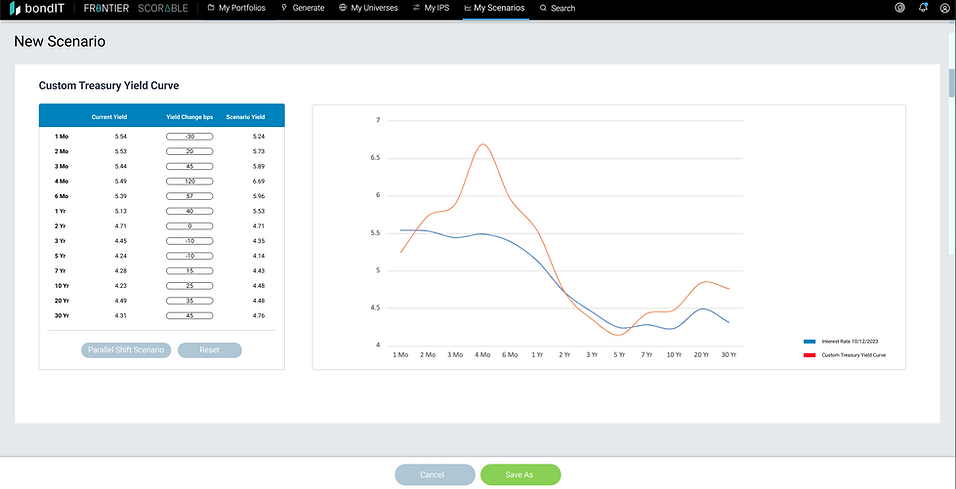
Create a comparison table showing Current | Change | New Scenario.
-
Separate market scenarios from user scenarios.
-
Determine how to display a preview of the scenarios.
-
Present different scenario states: New Scenario, Edit Scenario, and
Run Scenario.

The Solution
-
I decided to show the comparison in the same way we display bond information, but split the widget into Live and Proposal.
-
I created a comparison table showing Current | Change | New Scenario.
-
The Preview appears by hovering over the EYE icon.
-
Different script states are on different pages: New Scenario and Edit Scenario on My Scenarios, and Run Scenario on Portfolio.

My Role and Team
As a UX/UI designer, I was deeply involved in every phase of the project—from initial concept, thorough research, and detailed wireframes to interactive prototypes, polished final UI design, and seamless handoff to the development team. I worked in close collaboration with product managers, R&D, QA and the marketing team to ensure a cohesive and user-centric design approach. My goal was to create an intuitive and engaging user experience that meets both business objectives and user needs.

Scenario Analysis
Scenario analysis is the process of estimating the expected value of a portfolio after a specific period, based on assumed changes in the values of the portfolio's securities or key factors, such as changes in interest rates.
It is commonly used to assess potential changes in a portfolio's value in response to unfavorable events and can be applied to examine a theoretical worst-case scenario.
Started with...
Problem 1
Complexity of the interface and information overload
Bond scenario analysis can involve numerous variables and complex data, such as interest rates, maturity dates, credit ratings, and other economic indicators. If the interface is too complicated or overloaded with information, users may find it difficult to locate the necessary data and understand the analysis results. It is crucial to provide an intuitive interface and logical organization of information to facilitate navigation and comprehension
Problem 2
Insufficient interactivity and data visualization:
Users often need data visualization to better understand scenarios and their potential outcomes. If the site does not provide enough opportunities for interactive engagement with charts, tables, and models, users may feel limited in their analyses. Incorporating dynamic charts that allow users to adjust parameters and see how these changes affect the results can significantly enhance the user experience.
Problem 3
Poorly designed data entry process Process
Scenario analysis requires entering various parameters and data. If the data entry process is inconvenient, overly complicated, or unintuitive, users may make mistakes or spend too much time setting up the analysis. Poorly designed input forms, lack of data validation, and absence of auto-completion features can cause frustration. User-friendly input forms with prompts, error checking, and the ability to import data from other sources will improve the user experience.
User Persona
Alex
40/ Married + 2 / Portfolio Manager / New York USA
Workday: Alex starts his day early, around 7:00 AM, to have breakfast with his
family. He spends most of his day in the office, analyzing markets, communicating with clients, and managing investments. His job requires attention to detail, analytical skills, and the ability to quickly respond to market changes.
After Work: Returning home around 6:00 PM, he tries to spend time with his family. Alex helps his children with their homework and has dinner with his wife and kids.
Evening: In the evenings, twice a week, he plays tennis with friends. This sport helps him relax, stay in shape, and socialize with like-minded people.
Investments: Even outside of work, Alex is interested in financial markets and investments. He follows news, reads specialized publications, and analyzes various financial instruments.
Goals and Motivations:
• Professional: Achieve the best results for his clients by staying up-to-date with the latest trends in financial markets. Constantly improve his skills and knowledge in the field of investments.
• Personal: Ensure financial stability and security for his family. Maintain a healthy balance between work and personal life, dedicating enough time to his family and interests.
Challenges and Issues:
• Time Management: Balancing work and personal life is challenging, especially when the market demands immediate actions.
• Stress: The high responsibility at work can lead to stress, and Alex seeks ways to reduce it.
• Technology: The constant development of technology in the banking sector requires Alex to continuously learn and adapt to new tools and software.
How Our Product Can Help Alex:
• Efficiency: Tools for quick analysis and portfolio management can save Alex time, allowing him to perform his tasks more efficiently.
• Information: Access to current and accurate market information, helping him make informed decisions.
• Balance: Solutions that help manage time and stress, such as reminders for important tasks and productivity analysis, can improve the balance between work and personal life.

SKETCHING
Flow Chart
After identifying all the problems and their solutions, we began creating the product, starting with the flow. We developed three different flows for three pages to best organize the user experience.
The flow provides an understanding of how the product works and helps product managers and developers complete their tasks more quickly and easily.
By visualizing the steps and interactions within the product, the flow ensures that everyone involved has a clear vision of the user journey. This not only improves collaboration among team members but also reduces the likelihood of misunderstandings and errors during development.
New Scenario

Run Scenario

Edit Scenario

Wireframes
After defining the flow, the next step was creating wireframes. Wireframes provide a visual representation of the structure and layout of pages, focusing on the placement of key interface elements. They help ensure that the interface will be intuitive and user-friendly. Wireframes also serve as a basis for discussions and gathering feedback from the team and stakeholders.
By using wireframes, we could easily test and make changes, allowing us to quickly respond to feedback and improve the interface structure. As a result, developers received clear guidelines, reducing development time and the number of iterations during the design phase. Wireframes helped us create a more functional and user-friendly product that meets users' needs.


Design System - Assets
To simplify and improve the workflow, I developed a comprehensive set of assets specifically for dropdown menus and tables.
These assets include all possible component states, ensuring that every interaction scenario is covered.
By creating these standardized assets, I not only streamline the integration process but also maintain consistency across different parts of the interface. This approach significantly enhances the overall user experience, making it more intuitive and reliable. It also reduces the time and effort required for development, allowing for quicker iterations and more efficient collaboration within the team.
Dropdown Behavior


Table behavior

The Final Design (UI)
After extensive work, including research, planning, and creating flow and wireframes, my team and I finally arrived at the final result. We carefully analyzed all the collected data and suggestions to create an effective and user-friendly solution.
One of the main tasks was to maintain the visual language of our system to ensure consistency and recognizability
of the interface.
I focused on refining the user interface to make it not only functional but also intuitive. We aimed to ensure that every element of the interface enhances the user experience and allows for easy and efficient interaction with the system.
Create New Scenario
Run Scenario

Bond's Level Scenario

Result
Results of Our Work:
During the development of this product, we focused on creating an intuitive and functional interface that helps users like Alex manage their investment portfolios efficiently. We addressed the need for quick access to relevant information, enhanced data visualization capabilities, and optimized the data entry process, which significantly simplified working with complex financial scenarios. Through close team collaboration and attention to detail, we succeeded in developing a solution that not only facilitates daily tasks but also helps users achieve their professional goals while staying at the top of their field.
Meticulous attention to detail during the design and testing phases allowed us to create a product that successfully combines functionality and user-friendliness, meeting user expectations.
How the Project Helps the User:
Our product provides Alex with powerful tools for quick and accurate portfolio analysis. It saves time by simplifying the data entry process and offering an intuitive interface. Interactive charts and models allow for easy evaluation of various scenarios and their outcomes, which improves the quality of decision-making. These features help Alex maintain a balance between work and personal life, reducing stress and increasing work efficiency.